As blockchain technology becomes more integral to modern digital infrastructure—from finance and supply chains to voting systems and digital identity—the need to understand its complex inner workings grows. However, blockchain is notoriously abstract and difficult to visualize. To bridge this gap, computer graphics experts and data visualization designers are leveraging interactive 3D models to make blockchain systems accessible, transparent, and even engaging to the public.
Traditional 2D charts and graphs are limited in their ability to convey the multilayered nature of blockchain data. Transactions, blocks, consensus mechanisms, cryptographic keys, and smart contracts all coexist in a dynamic ecosystem. Interactive 3D graphics help to untangle this complexity by providing spatial depth and real-time interaction, allowing users to explore decentralized systems like never before.
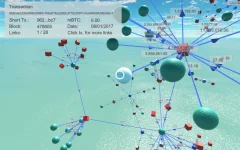
One compelling use of 3D visualization is the representation of blockchain networks. Instead of viewing transactions as rows in a table, they can be seen as nodes within a vast, living network. Each node might represent a wallet, a miner, or a block, connected by animated lines that symbolize transactions. Users can rotate the view, zoom into specific blocks, and click to reveal metadata such as transaction size, gas fees, or digital signatures.
By visualizing this in three dimensions, users gain a holistic understanding of how decentralized operations flow. For instance, anomalies such as bottlenecks or spam attacks on the network become easier to identify when visually highlighted within a graphical framework. Some tools even color-code nodes based on behavior—e.g., green for normal, red for suspicious—helping both developers and casual users see problems at a glance.
Another key area of 3D visualization is smart contract behavior. These self-executing programs on the blockchain are difficult to interpret in raw code. With 3D graphics, their execution can be represented visually, almost like flowcharts that animate in real time. This helps non-programmers understand how inputs produce outputs, how tokens move, or how governance proposals are implemented.
Educational platforms are also adopting this approach. Through gamified blockchain explorers or virtual reality (VR) interfaces, students and investors can walk through a simulated blockchain, witnessing how blocks are mined, how consensus is reached, and how forks happen. This immersive learning environment turns abstract technology into tangible experience.
Moreover, 3D blockchain graphics are not limited to desktops. Many mobile apps now feature simplified 3D block explorers, allowing users to interact with their wallets and transaction history through a dynamic interface. Some NFT marketplaces, for example, present ownership chains and provenance histories as interactive 3D paths, making it easier to trace authenticity and origin.
From a design perspective, building 3D graphics for blockchain systems poses unique challenges. The underlying data is often enormous, decentralized, and continuously updating. Designers must balance real-time responsiveness with visual clarity, avoiding clutter while still offering detailed insights. Technologies such as WebGL, Three.js, and Unity are commonly used to develop these interfaces, enabling browser-based, lightweight, and highly interactive environments.
Looking ahead, we can expect blockchain visualization to evolve with artificial intelligence. AI could automatically generate visual insights, highlight important trends, or detect suspicious activities through pattern recognition—presented in real-time 3D for instant action.
In the enterprise world, blockchain visual dashboards are already assisting logistics, legal, and finance professionals in tracking digital contracts and asset flows. In public contexts, they increase transparency by allowing anyone to "see" what’s happening on a blockchain, promoting trust in decentralized systems.
In conclusion, 3D computer graphics are playing a vital role in demystifying blockchain technology. Through intuitive, interactive, and immersive designs, these visual tools are not only improving understanding but also shaping how blockchain is adopted and trusted by broader audiences.
Join the Conversation:
Have you ever used a 3D blockchain explorer or visualization tool?
Do you think visualizations make decentralized technology more approachable?
What would you like to see improved in current blockchain UI/UX?
Let’s discuss in the comments below!
Traditional 2D charts and graphs are limited in their ability to convey the multilayered nature of blockchain data. Transactions, blocks, consensus mechanisms, cryptographic keys, and smart contracts all coexist in a dynamic ecosystem. Interactive 3D graphics help to untangle this complexity by providing spatial depth and real-time interaction, allowing users to explore decentralized systems like never before.
One compelling use of 3D visualization is the representation of blockchain networks. Instead of viewing transactions as rows in a table, they can be seen as nodes within a vast, living network. Each node might represent a wallet, a miner, or a block, connected by animated lines that symbolize transactions. Users can rotate the view, zoom into specific blocks, and click to reveal metadata such as transaction size, gas fees, or digital signatures.
By visualizing this in three dimensions, users gain a holistic understanding of how decentralized operations flow. For instance, anomalies such as bottlenecks or spam attacks on the network become easier to identify when visually highlighted within a graphical framework. Some tools even color-code nodes based on behavior—e.g., green for normal, red for suspicious—helping both developers and casual users see problems at a glance.
Another key area of 3D visualization is smart contract behavior. These self-executing programs on the blockchain are difficult to interpret in raw code. With 3D graphics, their execution can be represented visually, almost like flowcharts that animate in real time. This helps non-programmers understand how inputs produce outputs, how tokens move, or how governance proposals are implemented.
Educational platforms are also adopting this approach. Through gamified blockchain explorers or virtual reality (VR) interfaces, students and investors can walk through a simulated blockchain, witnessing how blocks are mined, how consensus is reached, and how forks happen. This immersive learning environment turns abstract technology into tangible experience.
Moreover, 3D blockchain graphics are not limited to desktops. Many mobile apps now feature simplified 3D block explorers, allowing users to interact with their wallets and transaction history through a dynamic interface. Some NFT marketplaces, for example, present ownership chains and provenance histories as interactive 3D paths, making it easier to trace authenticity and origin.
From a design perspective, building 3D graphics for blockchain systems poses unique challenges. The underlying data is often enormous, decentralized, and continuously updating. Designers must balance real-time responsiveness with visual clarity, avoiding clutter while still offering detailed insights. Technologies such as WebGL, Three.js, and Unity are commonly used to develop these interfaces, enabling browser-based, lightweight, and highly interactive environments.
Looking ahead, we can expect blockchain visualization to evolve with artificial intelligence. AI could automatically generate visual insights, highlight important trends, or detect suspicious activities through pattern recognition—presented in real-time 3D for instant action.
In the enterprise world, blockchain visual dashboards are already assisting logistics, legal, and finance professionals in tracking digital contracts and asset flows. In public contexts, they increase transparency by allowing anyone to "see" what’s happening on a blockchain, promoting trust in decentralized systems.
In conclusion, 3D computer graphics are playing a vital role in demystifying blockchain technology. Through intuitive, interactive, and immersive designs, these visual tools are not only improving understanding but also shaping how blockchain is adopted and trusted by broader audiences.
Join the Conversation:
Have you ever used a 3D blockchain explorer or visualization tool?
Do you think visualizations make decentralized technology more approachable?
What would you like to see improved in current blockchain UI/UX?
Let’s discuss in the comments below!