Computer graphics have transformed the landscape of genetic science, especially in visualizing the human genome—a task that involves decoding, analyzing, and understanding billions of DNA base pairs. The vast complexity and volume of genomic data are nearly impossible to grasp without effective visual representation, and this is where computer graphics play a vital role. By transforming raw sequences into comprehensible visual forms, researchers and students alike gain intuitive insights into genetic structures, patterns, and relationships.
Visualizing the human genome using computer graphics is not simply about pretty images; it's about functional clarity. Tools like UCSC Genome Browser, Ensembl, and Integrative Genomics Viewer (IGV) rely on advanced graphics to present dense genomic data in formats such as chromosome maps, gene expression heatmaps, and interactive alignment diagrams. These graphics help scientists pinpoint genetic variations, study gene functions, and even track hereditary diseases with precision.
One of the breakthroughs in this field is the use of 3D graphics to model DNA at multiple levels—from the double helix to nucleosomes and entire chromosome territories within the nucleus. These models not only reveal the structure but also simulate the dynamic behavior of DNA, such as folding patterns and interactions between genes. Software like Chimera, Genome3D, and PyMOL enable researchers to create lifelike molecular visualizations that support hypothesis testing, drug development, and educational demonstrations.
These visualizations also play a major role in communicating science to the public. For example, animated videos showing how DNA replication or transcription occurs have become invaluable tools in classrooms and public science communication. They bridge the gap between abstract molecular biology and layperson understanding, thanks to the storytelling potential of animated computer graphics.
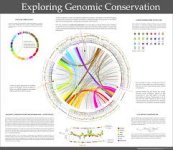
Additionally, data visualization techniques such as circular genome plots (Circos), SNP (Single Nucleotide Polymorphism) distribution maps, and interactive genomic timelines allow for better comparison between different genetic data sets. These visual tools help in identifying genome-wide associations linked to conditions like cancer, diabetes, and mental health disorders. The layered visual formats make it easier to find correlations and causations, especially when dealing with population-level studies.
Another emerging area is virtual reality (VR) applications in genomic research. Scientists can now wear VR headsets to explore genome structures in immersive 3D environments. Such interaction enhances spatial awareness of genetic elements and provides new dimensions for understanding how mutations or structural variants impact gene function.
Computer graphics have also enhanced bioinformatics platforms where artificial intelligence processes genetic data and outputs visual summaries. These dashboards use intuitive color coding, bar graphs, pie charts, and interactive sliders to help users explore datasets at various depths. The use of motion graphics further enhances the user experience, especially when simulating processes like CRISPR gene editing or cellular reproduction based on genome instructions.
Despite the advances, challenges persist. Accurate rendering of massive genomic datasets while maintaining real-time interactivity demands high computational power. Moreover, making these visualizations accessible and usable for researchers with limited technical backgrounds remains an ongoing goal. User-friendly interfaces and cross-platform compatibility are crucial in democratizing genomic visualization.
In summary, the visualization of the human genome through computer graphics has opened unprecedented avenues in genetics, medicine, and education. It has made the invisible world of DNA visible, interactive, and comprehensible. As genomic data continues to grow in scale and significance, the role of advanced graphics will only deepen—transforming how we understand life at its most fundamental level.
Join the Conversation:
Have you ever used or seen a genome visualization tool?
Do you believe visualizing DNA can help more people understand genetics better?
What improvements would you suggest for making genome graphics more accessible?
Let us know your thoughts in the comments!
Visualizing the human genome using computer graphics is not simply about pretty images; it's about functional clarity. Tools like UCSC Genome Browser, Ensembl, and Integrative Genomics Viewer (IGV) rely on advanced graphics to present dense genomic data in formats such as chromosome maps, gene expression heatmaps, and interactive alignment diagrams. These graphics help scientists pinpoint genetic variations, study gene functions, and even track hereditary diseases with precision.
One of the breakthroughs in this field is the use of 3D graphics to model DNA at multiple levels—from the double helix to nucleosomes and entire chromosome territories within the nucleus. These models not only reveal the structure but also simulate the dynamic behavior of DNA, such as folding patterns and interactions between genes. Software like Chimera, Genome3D, and PyMOL enable researchers to create lifelike molecular visualizations that support hypothesis testing, drug development, and educational demonstrations.
These visualizations also play a major role in communicating science to the public. For example, animated videos showing how DNA replication or transcription occurs have become invaluable tools in classrooms and public science communication. They bridge the gap between abstract molecular biology and layperson understanding, thanks to the storytelling potential of animated computer graphics.
Additionally, data visualization techniques such as circular genome plots (Circos), SNP (Single Nucleotide Polymorphism) distribution maps, and interactive genomic timelines allow for better comparison between different genetic data sets. These visual tools help in identifying genome-wide associations linked to conditions like cancer, diabetes, and mental health disorders. The layered visual formats make it easier to find correlations and causations, especially when dealing with population-level studies.
Another emerging area is virtual reality (VR) applications in genomic research. Scientists can now wear VR headsets to explore genome structures in immersive 3D environments. Such interaction enhances spatial awareness of genetic elements and provides new dimensions for understanding how mutations or structural variants impact gene function.
Computer graphics have also enhanced bioinformatics platforms where artificial intelligence processes genetic data and outputs visual summaries. These dashboards use intuitive color coding, bar graphs, pie charts, and interactive sliders to help users explore datasets at various depths. The use of motion graphics further enhances the user experience, especially when simulating processes like CRISPR gene editing or cellular reproduction based on genome instructions.
Despite the advances, challenges persist. Accurate rendering of massive genomic datasets while maintaining real-time interactivity demands high computational power. Moreover, making these visualizations accessible and usable for researchers with limited technical backgrounds remains an ongoing goal. User-friendly interfaces and cross-platform compatibility are crucial in democratizing genomic visualization.
In summary, the visualization of the human genome through computer graphics has opened unprecedented avenues in genetics, medicine, and education. It has made the invisible world of DNA visible, interactive, and comprehensible. As genomic data continues to grow in scale and significance, the role of advanced graphics will only deepen—transforming how we understand life at its most fundamental level.
Join the Conversation:
Have you ever used or seen a genome visualization tool?
Do you believe visualizing DNA can help more people understand genetics better?
What improvements would you suggest for making genome graphics more accessible?
Let us know your thoughts in the comments!