Quantum computing is one of the most complex and transformative fields in modern science and technology. Yet, for many, understanding quantum concepts such as superposition, entanglement, and quantum gates remains extremely challenging. This is where computer graphics plays a vital role—by turning abstract quantum theories into visual, interactive experiences that can be understood by learners, researchers, and the general public alike.
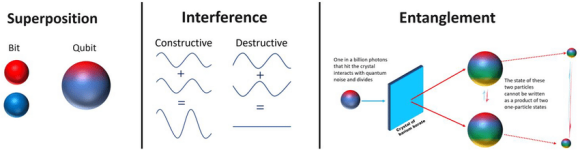
Unlike classical computing, which operates with binary bits (0 or 1), quantum computing uses qubits that can exist in multiple states simultaneously. This abstract idea is difficult to grasp without a visual aid. Through computer graphics, developers can simulate the behavior of qubits using rotating vectors, spheres (Bloch spheres), and color-coded paths to indicate probabilities and entangled states. These visual metaphors help bridge the gap between mathematical formulas and intuitive understanding.
One powerful tool that utilizes graphics for quantum education is IBM’s Quantum Composer. This browser-based simulator provides drag-and-drop interfaces where users can build quantum circuits and instantly visualize their operation. Gates like Hadamard, Pauli-X, and CNOT can be animated to show their effect on qubit states, and the entire transformation is rendered visually using state vector diagrams. These animations make it easier for students and professionals alike to follow quantum logic step-by-step.
Additionally, 3D modeling tools are being developed to simulate entangled qubits and visualize how their states change in response to operations. Animations showing quantum teleportation, interference patterns, or decoherence processes help demystify topics that were once locked within academic papers. These visual representations can also be used in university lectures, online courses, and public exhibitions.
Augmented and virtual reality (AR/VR) are pushing this even further. By entering a VR space, learners can "walk around" quantum states, rotate them in space, and interact with live simulations. This spatial interaction enables deeper cognitive engagement and helps people see quantum logic in action—not just in abstract numbers. Such immersive graphics are being explored in academic projects and start-ups focused on quantum education.
Computer graphics also assist in the visualization of quantum algorithms. Rather than just displaying code or matrix operations, interfaces can show the algorithm’s flow through quantum gates in real time. For example, Grover’s algorithm for database search or Shor’s algorithm for factorization can be visualized to show how quantum speedup works at each stage.
Beyond education, quantum computing visualizations are useful in research and debugging. Quantum developers use heatmaps, error rate plots, and live circuit animations to monitor real-time performance of quantum processors. These graphic interfaces allow scientists to catch errors or optimize algorithms faster than by using numerical data alone.
Moreover, for public understanding and outreach, these visualizations are crucial. As quantum technology moves toward mainstream use in encryption, materials science, and AI, it becomes essential to communicate its principles clearly. Graphics turn the seemingly magical world of quantum mechanics into something people can see, interact with, and appreciate.
In conclusion, computer graphics are proving to be indispensable in making quantum computing accessible and engaging. Whether for education, research, or public outreach, graphics help decode the invisible, animate the abstract, and illuminate one of the most promising technologies of our time. As quantum computing advances, so too will the role of visual storytelling in shaping its future.
Join the Conversation:
Have you used any tools to learn about quantum computing?
Do you think visualizing complex science topics makes them easier to grasp?
What kind of interactive features would help you understand quantum algorithms better?
Let us know your thoughts in the comments!