In the age of instant information, weather forecasts have become more than just a side segment in news broadcasts. With climate events becoming more frequent and unpredictable, viewers now expect real-time, visually engaging, and easy-to-understand weather updates.
This demand has driven news media outlets to embrace weather simulation graphics—powered by computer graphics, real-time data, and atmospheric modeling. These visuals not only inform but also educate and prepare the public in a way that static forecasts never could.
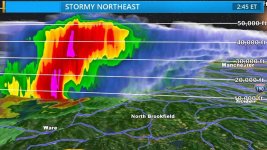
Weather simulation graphics are computer-generated visual representations of meteorological data. They help translate complex forecasts into clear and engaging visuals such as:
These visuals enhance storytelling in news, improve public understanding, and help deliver life-saving alerts with higher impact.
These are sophisticated computer models that simulate atmospheric behavior based on mathematical formulas. Popular ones include:
These models serve as the backbone of the data used for graphic visualization.
Tools like Weather Central, The Weather Company’s Max Platform, and MetraWeather convert raw weather data into high-quality graphics. These allow meteorologists to animate storms, compare temperatures, or zoom into specific regions.
AR brings the weather indoors. Broadcasters now appear to walk through simulated hurricanes or wildfires—providing immersive and interactive forecasts. These AR graphics blend real footage with simulated scenarios, enhancing viewer engagement.
Weather graphics have transformed the role of weather segments in several ways:
During extreme events like Hurricane Ida or Cyclone Amphan, news broadcasters employed weather simulation graphics to:
In addition to broadcasting, weather graphics serve an educational purpose:
Weather graphics are rapidly evolving with trends such as:
These advancements aim to make weather segments not just informative but indispensable.
Do you find weather graphics helpful during news broadcasts?
Have you ever acted based on a simulation you saw on TV?
What kind of weather information would you like presented visually in the future?
Share your views in the comments below!
This demand has driven news media outlets to embrace weather simulation graphics—powered by computer graphics, real-time data, and atmospheric modeling. These visuals not only inform but also educate and prepare the public in a way that static forecasts never could.
What Are Weather Simulation Graphics?
Weather simulation graphics are computer-generated visual representations of meteorological data. They help translate complex forecasts into clear and engaging visuals such as:
- Moving storm paths
- Rainfall animations
- 3D cloud and wind formations
- Live temperature maps
- Interactive radar overlays
These visuals enhance storytelling in news, improve public understanding, and help deliver life-saving alerts with higher impact.
The Technology Behind It
1. Numerical Weather Prediction (NWP) Models
These are sophisticated computer models that simulate atmospheric behavior based on mathematical formulas. Popular ones include:
- GFS (Global Forecast System)
- ECMWF (European Centre for Medium-Range Weather Forecasts)
These models serve as the backbone of the data used for graphic visualization.
2. Visualization Engines
Tools like Weather Central, The Weather Company’s Max Platform, and MetraWeather convert raw weather data into high-quality graphics. These allow meteorologists to animate storms, compare temperatures, or zoom into specific regions.
3. Augmented Reality (AR)
AR brings the weather indoors. Broadcasters now appear to walk through simulated hurricanes or wildfires—providing immersive and interactive forecasts. These AR graphics blend real footage with simulated scenarios, enhancing viewer engagement.
How It Enhances News Delivery
Weather graphics have transformed the role of weather segments in several ways:
- Improved Clarity: Viewers can instantly understand the scale and direction of storms.
- Real-Time Updates: Data visualizations are updated on the fly during breaking news like cyclones or floods.
- Audience Retention: Visually appealing content keeps viewers glued to the screen.
- Risk Awareness: Simulation of flash floods, heatwaves, or snowfall alerts viewers in advance and aids emergency preparedness.
Case Study: Hurricane Coverage
During extreme events like Hurricane Ida or Cyclone Amphan, news broadcasters employed weather simulation graphics to:
- Animate storm surges and wind patterns
- Show evacuation zones and timelines
- Simulate damage possibilities using 3D maps
This level of detail has become essential in helping people take real threats seriously.
Education Through Visualization
In addition to broadcasting, weather graphics serve an educational purpose:
- Schools use them in geography and science classes
- Environmental awareness campaigns integrate climate visualizations
- Public service announcements rely on graphics to explain El Niño, La Niña, ozone depletion, and greenhouse effects
Challenges Faced
- Data Volume: Meteorological datasets are enormous and complex to render quickly.
- Misinterpretation Risk: Overly stylized visuals can sometimes lead to confusion if not explained clearly.
- Cost of Implementation: High-end software, hardware, and training can be expensive for small media outlets.
The Future of Weather Graphics
Weather graphics are rapidly evolving with trends such as:
- Personalized forecasts based on viewer location
- AI-driven simulations for more accurate predictions
- 360-degree weather studios for immersive newsrooms
- Integration with mobile apps for viewer-driven visual customization
These advancements aim to make weather segments not just informative but indispensable.
Join the Conversation
Do you find weather graphics helpful during news broadcasts?
Have you ever acted based on a simulation you saw on TV?
What kind of weather information would you like presented visually in the future?
Share your views in the comments below!