Geology and seismology are fields that deal with processes hidden beneath the Earth’s surface. Since direct observation is often impossible, researchers rely on sophisticated computer graphics and visualization techniques to interpret underground structures, monitor tectonic movements, and simulate seismic events. These visual tools are not only critical for scientific discovery but also play a key role in early warning systems, resource management, and public education.
Geological mapping involves identifying and charting different types of rocks, fault lines, and mineral deposits. Seismic mapping, on the other hand, uses data from earthquakes and man-made tremors to understand how seismic waves travel through the Earth.
Both these fields generate large, complex datasets. To make sense of them, scientists depend on computer graphics—especially 3D modeling, real-time animation, and Geographic Information Systems (GIS).
These tools allow experts and even non-specialists to visualize Earth’s complex systems clearly and interactively.
Nonetheless, with constant technological advancements, these challenges are becoming easier to overcome.
The next generation of geological visualization may include:
The combination of AI and graphics can help simulate previously unimaginable scenarios with accuracy and speed.
Have you ever seen a visual representation of an earthquake or volcano that helped you understand it better?
Do you think 3D geological maps should be used more in schools and disaster training programs?
How else could graphics help us prepare for natural hazards?
Let us know your thoughts in the comments!
What Is Geological and Seismic Mapping?
Geological mapping involves identifying and charting different types of rocks, fault lines, and mineral deposits. Seismic mapping, on the other hand, uses data from earthquakes and man-made tremors to understand how seismic waves travel through the Earth.
Both these fields generate large, complex datasets. To make sense of them, scientists depend on computer graphics—especially 3D modeling, real-time animation, and Geographic Information Systems (GIS).
How Computer Graphics Help in Geological Visualization
- 3D Terrain Modeling:
Computer graphics transform elevation and satellite data into detailed digital elevation models (DEMs), enabling geologists to study slopes, landforms, and rock formations. - Fault Line Simulations:
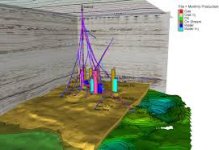
Using seismic data, 3D animations can simulate how fault lines shift during earthquakes—important for predicting future hazards. - Subsurface Mapping:
Graphics software can visualize what lies beneath the surface, including underground water channels, oil reservoirs, or magma chambers. - Volcano Monitoring and Simulation:
Scientists use heat maps and 3D eruption models to monitor volcanic activity and prepare evacuation strategies. - Time-Lapse Visualizations:
Over time, data can be turned into animations showing erosion, land shifts, or tectonic drift.
Software Tools Commonly Used
- ArcGIS and QGIS for spatial mapping and topographical visualizations.
- Petrel and GoCAD for modeling subsurface geological formations.
- Blender and Maya for visual storytelling in documentaries or public awareness campaigns.
- Google Earth Pro for integrating multiple data layers in real-time.
These tools allow experts and even non-specialists to visualize Earth’s complex systems clearly and interactively.
Use Cases: Where These Graphics Matter
- Disaster Preparedness: Government agencies use seismic simulations to understand risk zones and plan infrastructure accordingly.
- Oil and Mineral Exploration: Geological graphics help companies reduce drilling risks and find optimal sites.
- Environmental Conservation: Mapping deforestation, erosion, and water movement assists in sustainable development planning.
- Education: Students and the general public learn better when abstract geological concepts are shown using interactive graphics.
Benefits of Graphics in This Field
- Enhances understanding of complex datasets
- Supports faster and more accurate decision-making
- Aids in visual communication of risks to the public
- Offers safer alternatives to in-field exploration
Challenges to Address
- Requires powerful computing systems for rendering large datasets
- Accurate interpretation depends on the quality of data
- Risk of oversimplification when data is turned into visuals for public use
Nonetheless, with constant technological advancements, these challenges are becoming easier to overcome.
The Future of Geological Graphics
The next generation of geological visualization may include:
- Virtual reality (VR) field trips to seismic zones
- Interactive web maps for public awareness
- AI-integrated graphics for real-time hazard prediction
- Crowdsourced geological data represented via real-time visual dashboards
The combination of AI and graphics can help simulate previously unimaginable scenarios with accuracy and speed.
Join the Conversation
Have you ever seen a visual representation of an earthquake or volcano that helped you understand it better?
Do you think 3D geological maps should be used more in schools and disaster training programs?
How else could graphics help us prepare for natural hazards?
Let us know your thoughts in the comments!