In an era where urbanization is accelerating at an unprecedented rate, the concept of smart cities has emerged as a transformative vision for future living. At the core of building these cities lies a powerful tool—computer graphics and visualization software. These tools enable planners, architects, engineers, and policymakers to create dynamic simulations of urban environments, optimize infrastructure, and plan for sustainability with extraordinary precision.
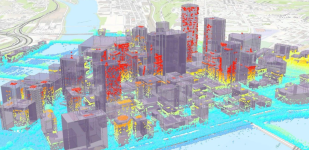
Visualization software allows urban planners to construct digital replicas of entire cities, often referred to as “digital twins.” These virtual models incorporate layers of real-time data, from traffic flow and energy consumption to public transportation and environmental conditions. By using 3D computer graphics, planners can simulate how changes in city design will affect living conditions, transportation networks, and even social dynamics.
For instance, before constructing a new metro line, city planners can visualize its impact on traffic congestion and pedestrian accessibility. These models help them optimize routes, station locations, and transfer points. Similarly, when evaluating the placement of parks, green roofs, or water drainage systems, computer-generated models help predict environmental impact, flooding risks, and heat distribution.
One of the key advantages of using 3D graphics in smart city planning is the ability to identify potential problems early. Developers can detect issues like shadow effects from tall buildings, insufficient lighting in alleys, or bottlenecks in traffic routes—long before the first brick is laid. This proactive approach not only saves money but also ensures that urban development aligns with community needs and sustainability goals.
Public engagement is another area where visualization excels. When cities present future projects to residents using realistic 3D renderings, citizens better understand proposed changes and provide more informed feedback. These visualizations bring abstract plans to life, showing people how new developments will look and function in the context of their neighborhoods.
Augmented reality (AR) and virtual reality (VR) tools further enhance the planning process. Stakeholders can virtually walk through planned smart city districts, interact with proposed transportation systems, or experience emergency evacuation routes in a simulated environment. This immersive planning improves decision-making and helps avoid costly redesigns down the line.
Moreover, city management teams use real-time dashboards powered by graphics engines to monitor utilities, pollution, population density, and infrastructure health. These data visualizations offer insights that allow for quicker response times to incidents, more efficient resource use, and long-term urban development strategies based on predictive analytics.
The role of computer graphics also extends to sustainability modeling. Simulating solar energy potential, analyzing airflow in dense urban spaces, and visualizing the carbon footprint of building materials help cities meet environmental targets. These simulations are essential in designing eco-friendly buildings and public spaces that contribute to healthier urban ecosystems.
Challenges remain, including integrating data from multiple sources, maintaining the accuracy of simulations, and ensuring cybersecurity for real-time systems. However, with continued advancements in AI, GIS (Geographic Information Systems), and GPU-powered rendering engines, these challenges are being addressed at a rapid pace.
In conclusion, visualization software powered by computer graphics is revolutionizing the way we design and manage cities. It empowers planners to build smarter, safer, and more livable urban environments by merging creativity with data-driven insights. As more cities adopt these tools, we edge closer to a future where urban growth is both sustainable and human-centered.
Join the Conversation:
Have you seen 3D models used in your city’s development plans?
How do you think computer graphics can help solve traffic or pollution issues?
Would you like to explore your future neighborhood in virtual reality?
Let us know your thoughts in the comments!