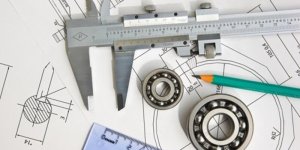
In engineering, failure is not just an outcome—it’s a lesson. Whether it's a collapsed bridge, a malfunctioning engine, or a cracked turbine blade, understanding why something failed is crucial to preventing future disasters. This is where computer graphics play a transformative role.
By using high-powered visualization tools, engineers today can simulate, analyze, and illustrate failures in ways that are intuitive, detailed, and precise. Instead of relying solely on numerical data or static 2D blueprints, failure analysis now harnesses the power of 3D modeling, simulations, and visual storytelling to uncover hidden design flaws, manufacturing defects, or material fatigue.
Engineering failure analysis is the process of:
This field is crucial in industries such as:
Using CAD (Computer-Aided Design) software like SolidWorks or CATIA, engineers recreate the failed part virtually. This helps in:
FEA is a graphic-driven simulation technique that visualizes:
Graphics-enabled simulations replicate extreme conditions such as:
By running these scenarios visually, engineers can pinpoint exactly when and where failure might begin.
CFD (Computational Fluid Dynamics) graphics help simulate:
Have you ever seen a failure investigation where graphics helped clarify the cause?
Should all engineering design processes include 3D failure simulations as a standard step?
Do you trust computer-generated simulations more than real-world testing?
Let us know your thoughts in the comments!
By using high-powered visualization tools, engineers today can simulate, analyze, and illustrate failures in ways that are intuitive, detailed, and precise. Instead of relying solely on numerical data or static 2D blueprints, failure analysis now harnesses the power of 3D modeling, simulations, and visual storytelling to uncover hidden design flaws, manufacturing defects, or material fatigue.
What Is Engineering Failure Analysis?
Engineering failure analysis is the process of:
- Investigating the root causes of a component or system breakdown.
- Understanding stress, load, fatigue, and environmental influences.
- Improving future designs and safety protocols based on findings.
This field is crucial in industries such as:
- Aerospace and aviation
- Civil engineering and construction
- Automotive manufacturing
- Oil and gas
- Nuclear and power generation
How Computer Graphics Aid in Failure Analysis
1.3D Modeling of Components
Using CAD (Computer-Aided Design) software like SolidWorks or CATIA, engineers recreate the failed part virtually. This helps in:
- Visualizing geometry and surface conditions.
- Analyzing alignment, dimensions, and tolerance.
- Simulating exact operating conditions.
2. Finite Element Analysis (FEA)
FEA is a graphic-driven simulation technique that visualizes:
- Stress concentrations
- Strain distribution
- Load-bearing behavior
It allows prediction of weak spots long before failure occurs.
3. Simulation of Real-World Scenarios
Graphics-enabled simulations replicate extreme conditions such as:
- Wind or seismic stress on buildings
- High pressure in pipelines
- Vibration fatigue in aircraft engines
By running these scenarios visually, engineers can pinpoint exactly when and where failure might begin.
4. Thermal and Fluid Flow Visualization
CFD (Computational Fluid Dynamics) graphics help simulate:
- Heat transfer in electronics or reactors
- Airflow over cars or aircraft
- Fluid behavior in valves and pumps
This is vital for heat-induced or erosion-related failures.
Case Examples: Graphics in Action
- Bridge Collapse Investigations: 3D animation models reconstruct the sequence of events, showing how load redistribution led to structural failure.
- Aerospace Component Failures: Thermal visualization reveals hotspots in jet engines leading to fatigue cracking.
- Product Recalls: Consumer electronics are digitally disassembled and tested in simulations to identify overheating or short-circuit risks.
Tools Commonly Used
- ANSYS – for FEA and thermal stress analysis
- Autodesk Fusion 360 – for mechanical modeling and stress visualization
- COMSOL Multiphysics – multiphysics simulations including mechanical, electrical, and chemical interactions
- Blender (Open-source) – for realistic rendering and forensic animation
Benefits of Using Graphics in Failure Analysis
- Clarity in Communication: Engineers can present failure causes clearly to non-technical stakeholders, including clients, insurers, or legal bodies.
- Time Efficiency: Simulations often take less time than physical prototypes or real-world testing.
- Cost Reduction: Virtual modeling helps avoid expensive destructive testing.
- Enhanced Safety: Future products are safer when designers can visualize how materials behave under stress.
Challenges and Limitations
- Accuracy Depends on Input: Poor data leads to misleading graphics.
- High Skill Requirement: Advanced graphics tools require expertise.
- Hardware Demands: Simulations may need high-performance computing resources.
- Over-reliance Risk: Engineers must still validate results with real-world tests.
Future Possibilities
- AI-Assisted Failure Prediction: Machine learning tools integrated with graphics software will spot patterns even human experts might miss.
- AR/VR Visualization: Engineers may soon walk through a failing bridge or engine using virtual reality to spot issues in real scale.
- Digital Twins: Real-time graphic replicas of working systems will help predict and prevent failures before they occur.
Join the Conversation
Have you ever seen a failure investigation where graphics helped clarify the cause?
Should all engineering design processes include 3D failure simulations as a standard step?
Do you trust computer-generated simulations more than real-world testing?
Let us know your thoughts in the comments!