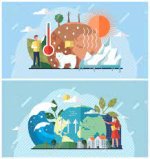
As the global climate crisis intensifies, the need for effective communication tools has become more urgent than ever. One such tool gaining traction in both scientific and creative communities is eco-visualization—the use of computer graphics to depict environmental issues, data, and solutions in an engaging and impactful way. Eco-visualizations bridge the gap between scientific knowledge and public understanding, turning complex datasets and trends into intuitive visual experiences that inspire awareness and action.
Computer graphics play a pivotal role in translating raw environmental data into compelling visuals. Whether through 3D simulations, interactive infographics, animated timelines, or real-time dashboards, these visuals provide a clearer picture of issues such as carbon emissions, deforestation, ocean pollution, and rising global temperatures. These representations are not only informative but also emotionally resonant, encouraging users to grasp the consequences of their actions and the urgency for change.
Eco-visualizations are used in diverse platforms: educational websites, government reports, documentary films, interactive exhibits, mobile apps, and even public art installations. For example, global temperature change over decades can be animated to show alarming trends, while 3D maps can illustrate the effects of sea level rise in coastal cities. Apps such as Earth Now (by NASA) and Climate Time Machine (by the Jet Propulsion Laboratory) use graphics to depict real-time environmental changes, making the invisible visible.
One of the most effective applications of eco-visualization is in carbon footprint tracking. Apps and platforms now allow users to visualize the environmental impact of their lifestyle choices—from transportation and energy consumption to dietary habits. By offering real-time feedback in visual formats such as meters, charts, or animated graphics, these tools promote informed decision-making and encourage sustainable behavior.
Another area where eco-visualization shines is in environmental storytelling. Through motion graphics and computer-generated imagery (CGI), storytellers can simulate future climate scenarios or recreate historical environmental events. Documentaries like Before the Flood or An Inconvenient Truth use these visual tools to captivate audiences and reinforce the narrative with scientific backing.
Eco-visualizations are also increasingly interactive. Web-based platforms enable users to explore datasets by region, time period, or environmental factor. For instance, a user could compare water scarcity in different parts of the world using sliders, heat maps, or layered visuals. These personalized experiences empower users to engage with environmental data at a deeper level and understand how global issues connect to local realities.
From a design perspective, creating effective eco-visualizations involves more than aesthetic appeal—it requires clarity, accessibility, and accuracy. Designers must carefully balance visual richness with simplicity, ensuring that the message is not lost in visual noise. Furthermore, accessibility considerations like color-blind-friendly palettes and screen-reader compatibility are essential for inclusive communication.
Artists and environmental activists are also leveraging computer graphics in creative ways. Augmented reality (AR) installations, VR simulations of forest ecosystems, and projection mapping of glacier melting are just a few examples of how art meets science to create impactful environmental experiences. These initiatives attract younger audiences, spark conversations, and often go viral on social media—expanding the reach of climate communication.
In conclusion, eco-visualizations represent a powerful intersection of technology, art, and environmental science. By transforming abstract data into meaningful visual stories, they foster greater understanding and inspire people to take action. As environmental challenges become more complex, the need for innovative, visually driven communication will only grow. Computer graphics will continue to be a crucial ally in the global effort to build a more sustainable future.
Join the Conversation:
Have you come across a visualization that changed how you view climate change?
Do you believe visual storytelling is key to solving environmental problems?
What kind of environmental graphics would you like to see more of?
Let us know your thoughts in the comments!